Why should you have 360 view analytics for your ERP with PowerBI analytics?
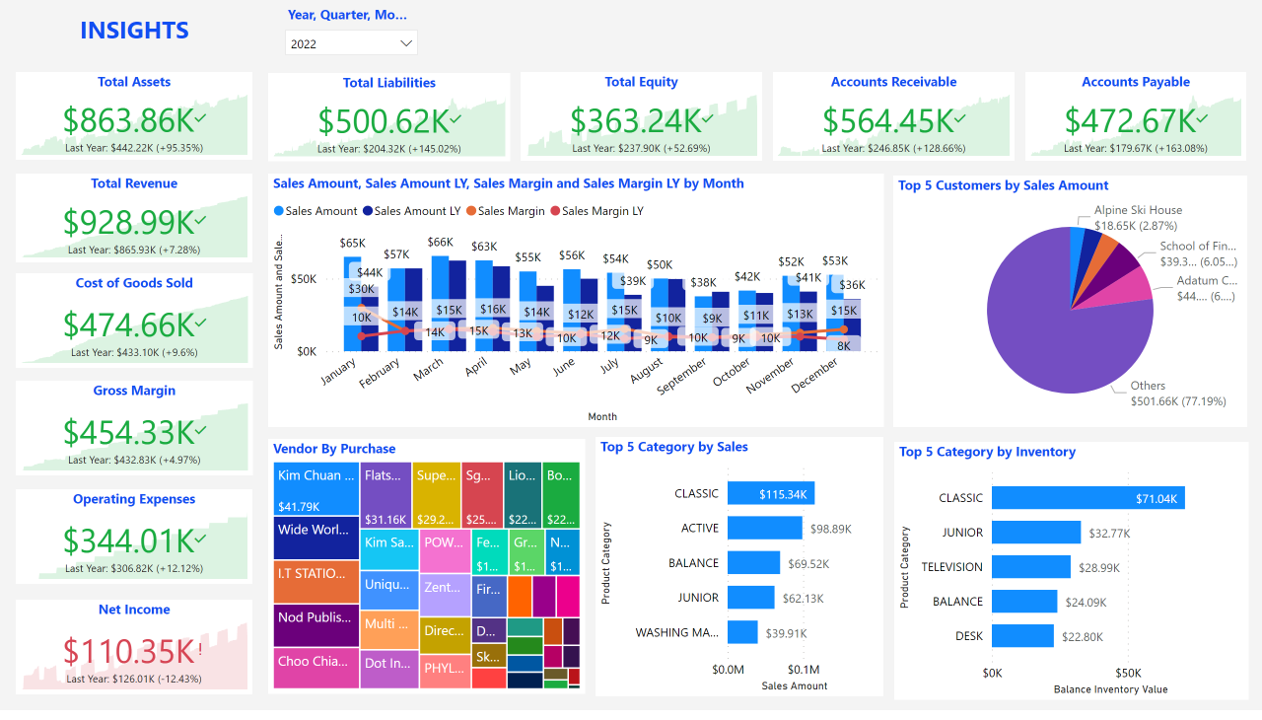
Analytics combines data from various departments and functions, providing a complete picture of an organization’s operations, financials, customer behavior, and more. With 360-degree analytics, managers can identify areas of improvement, track progress, and make data-driven decisions to drive business growth and success
Financial Analytics
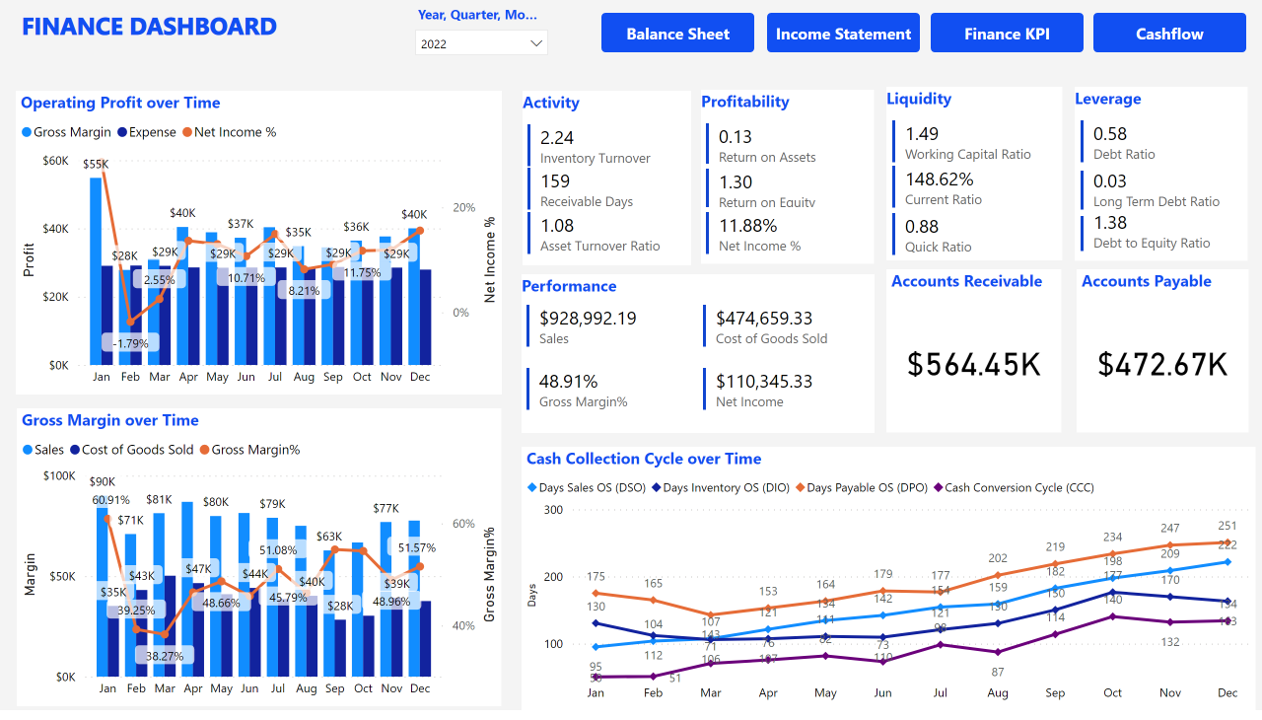
Analyze Your ERP Finance Data
ERP 360 View analytics enables you to understand the core fundamentals of the company financial management by reviewing its financial statements namely the Income Statement, Balance Sheet and Cash Flows. Typically, such financial analytics is done over a series of reporting periods
Sales Analysis
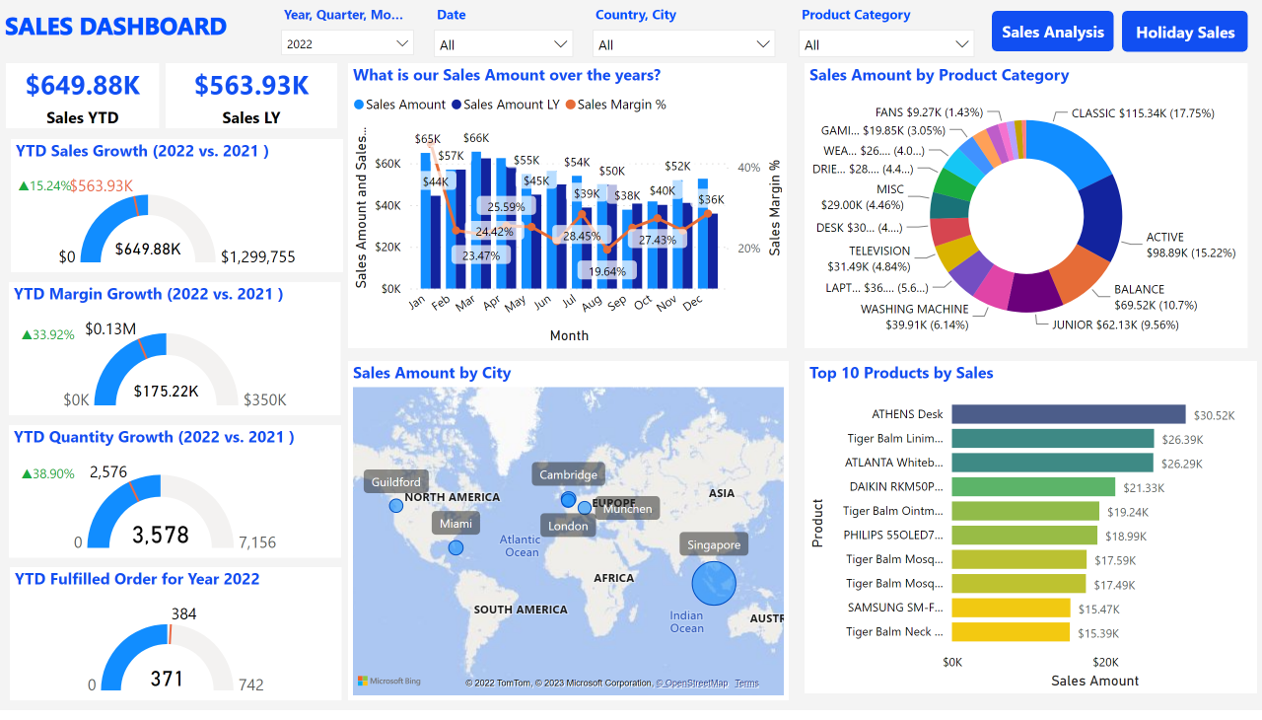
Sales & Marketing Analysis
It helps to increase sales revenues by acting on the most profitable products/services. Engage more customers by understanding market behavior. Streamline your investments by targeting on the added-value market segment. It also helps to optimize your stock management.
Purchase Analysis
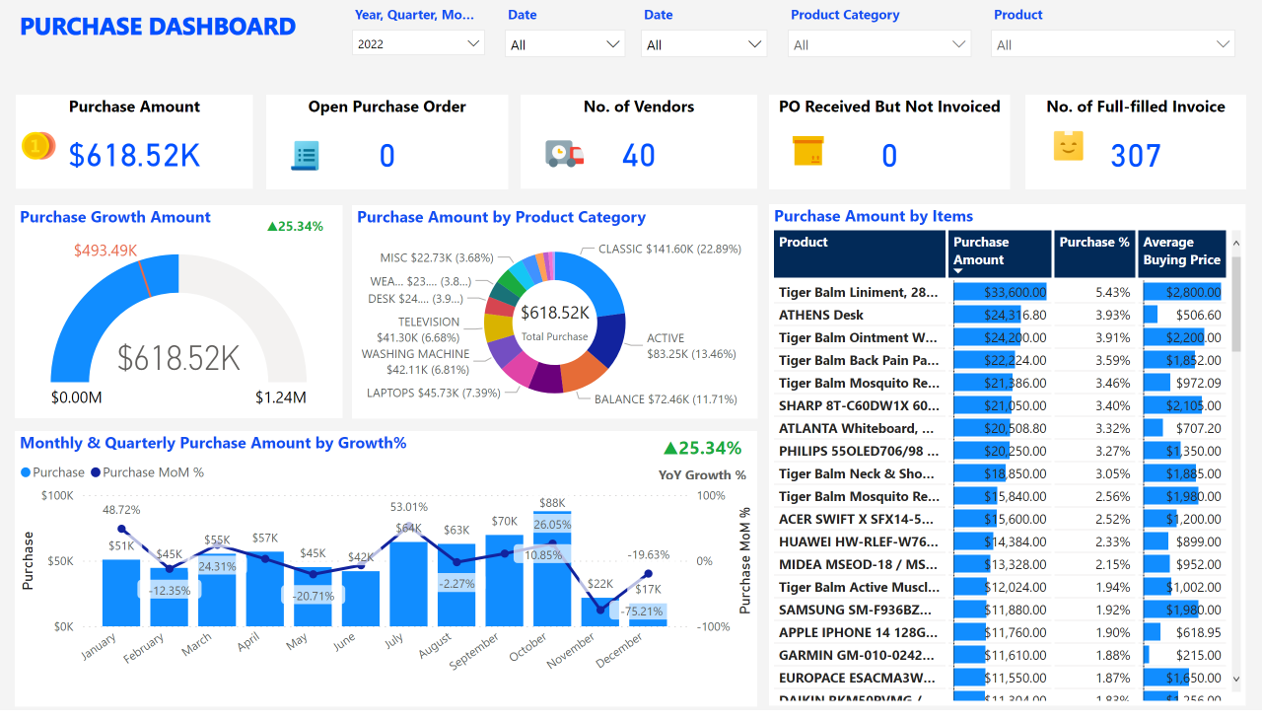
To perform analysis of purchases by period (current year, current month, previous month)
Analyses of what goes on in your purchasing department, are they keeping to the purchasing strategy and are inventories being kept to the optimum levels. With respect to suppliers, are the best suppliers been chosen and are they offering the best prices and terms?
Inventory Management
It is the basis of a well-functioning retail business.
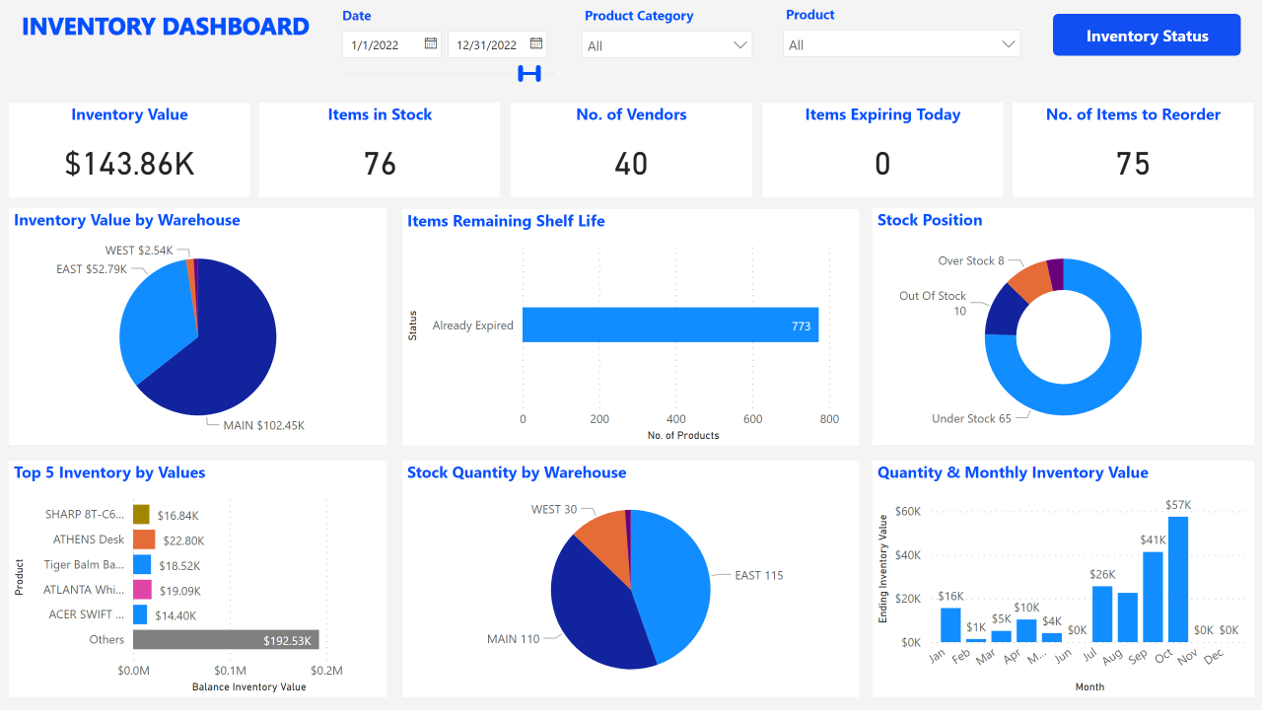
Optimizes your stock management like Out-of-Stock, Under-Stock, At-Stock, Over-Stock, Inventory Value, etc., Also this module focus on Shelf life Analysis which helps in determining the length of time that a commodity may be stored without becoming unfit for use, consumption, or sale
