Reporting and Analytics Basics in Business Central: From Reports to Power BI Insights
In today’s data-driven business environment, reporting is no longer just about generating numbers — it’s about gaining actionable insights that drive better decisions. Microsoft Dynamics 365 Business Central provides a strong foundation for reporting, while Power BI extends those capabilities into advanced analytics and visualization.
In this blog, we explore how businesses can move from basic reporting in Business Central to advanced analytics using Power BI, helping organizations transform raw data into meaningful business intelligence.
Watch the Full Demo
Why Reporting and Analytics Matter
Reporting plays a critical role in understanding business performance. However, traditional reporting methods often fall short when it comes to real-time decision-making.
Modern organizations require:
- Real-time visibility into operations
- Accurate financial tracking
- Data-driven decision-making
- Interactive dashboards and insights
Business Central and Power BI together address these needs by providing both operational reporting and advanced analytics capabilities.
Business Central Basic Reports
Business Central offers a range of built-in reports that provide structured and reliable data across different business functions.
Financial Reports
Financial reporting is essential for tracking the organization’s financial health and ensuring compliance.
Key Use Cases:
- Month-end closing
- Financial audits
- Budget comparison
- Profitability analysis
The Trial Balance report is one of the most widely used reports, providing a snapshot of all accounts and balances.
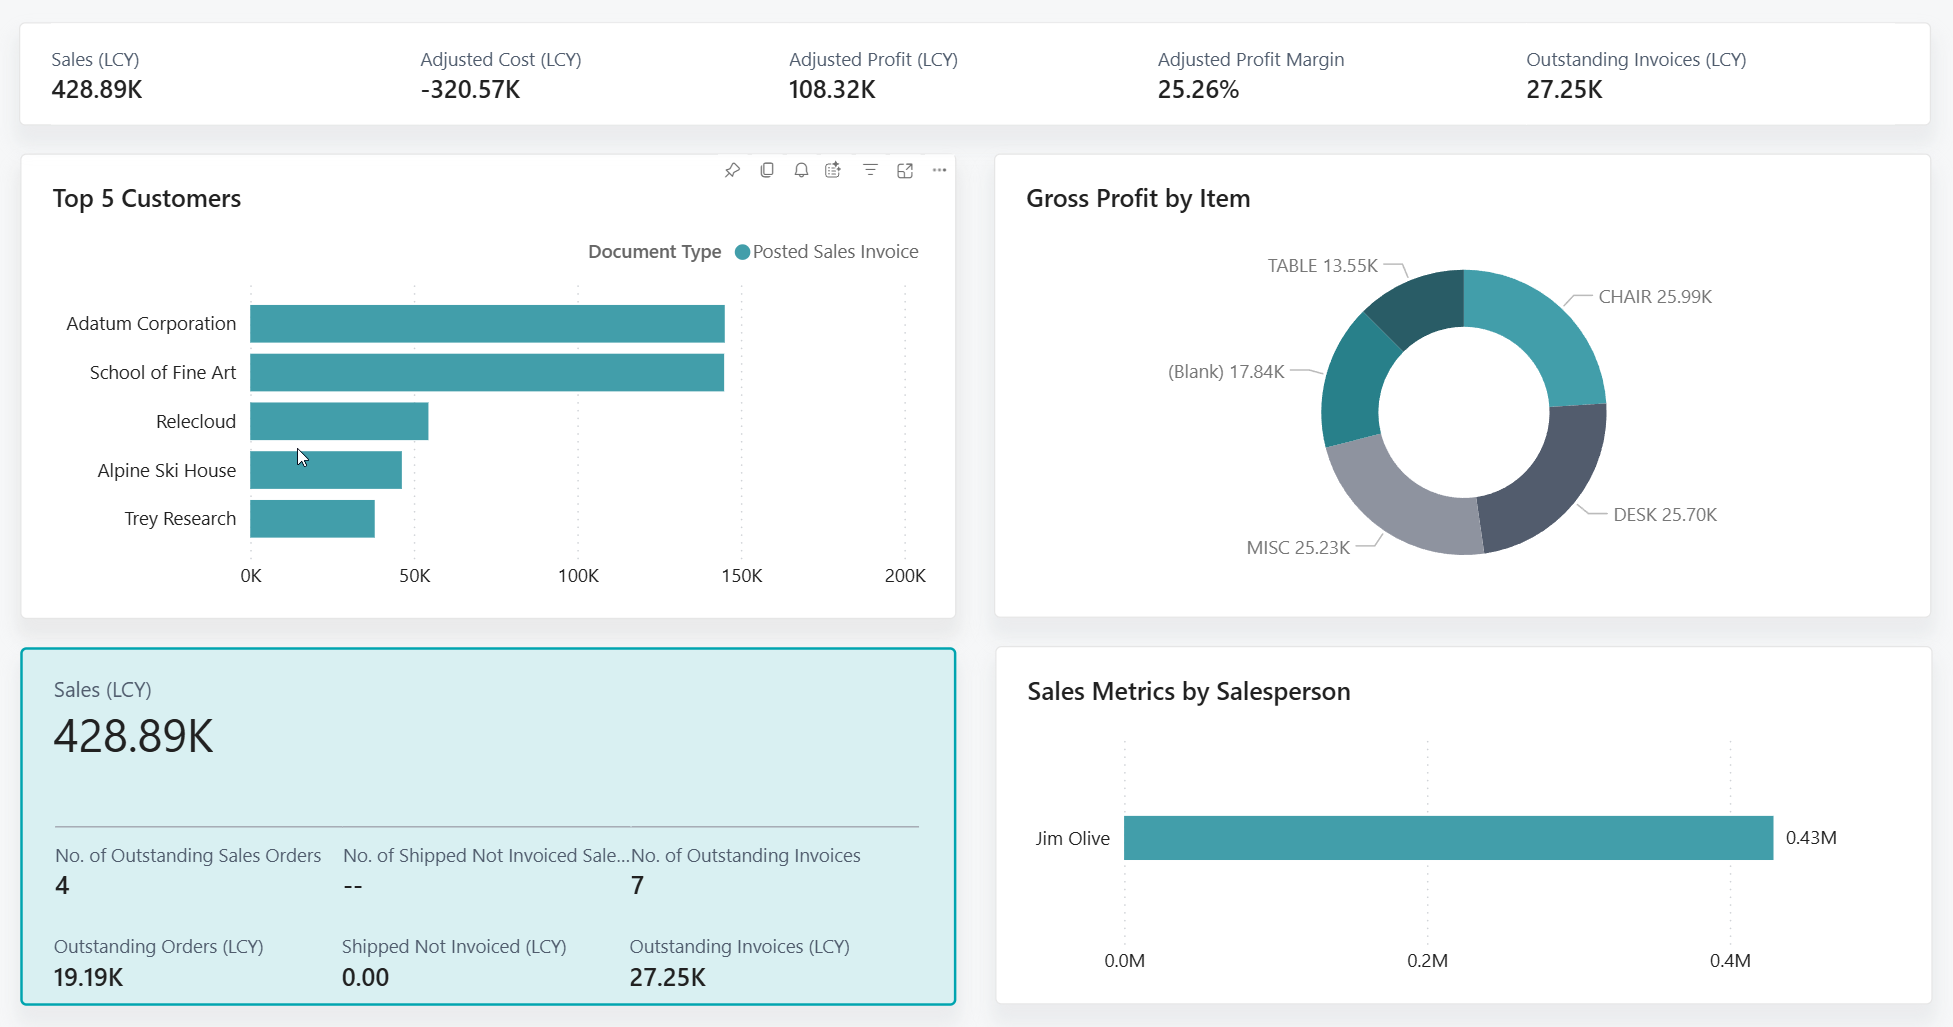
Sales Reports
Sales reporting helps businesses understand revenue generation and customer behavior.
Key Insights:
- Customer-wise sales performance
- Item-wise sales trends
- Revenue contribution by category
The Customer/Item Sales report provides a detailed breakdown of products sold to customers.
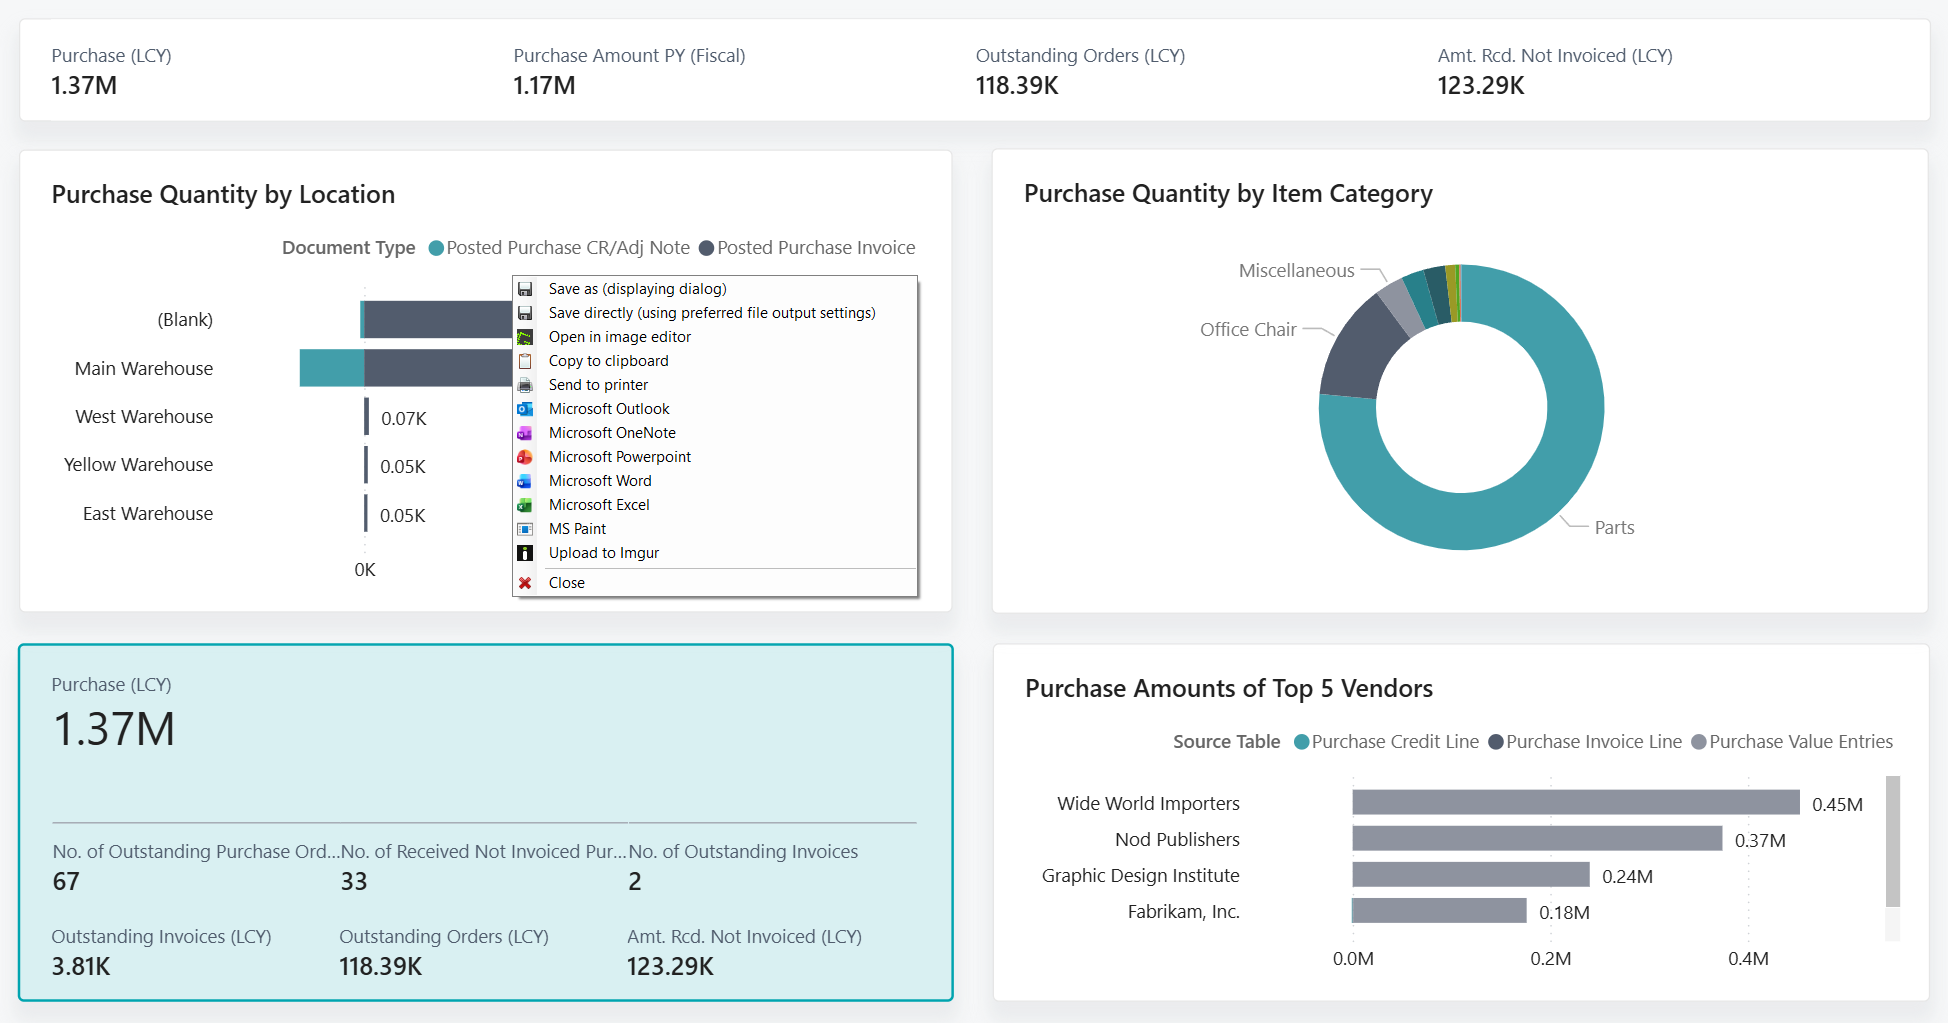
Purchase Reports
Purchase reports focus on vendor activity and procurement patterns.
Key Insights:
- Vendor performance
- Purchase trends
- Procurement costs
The Vendor/Item Purchases report helps track what is being purchased and from whom.
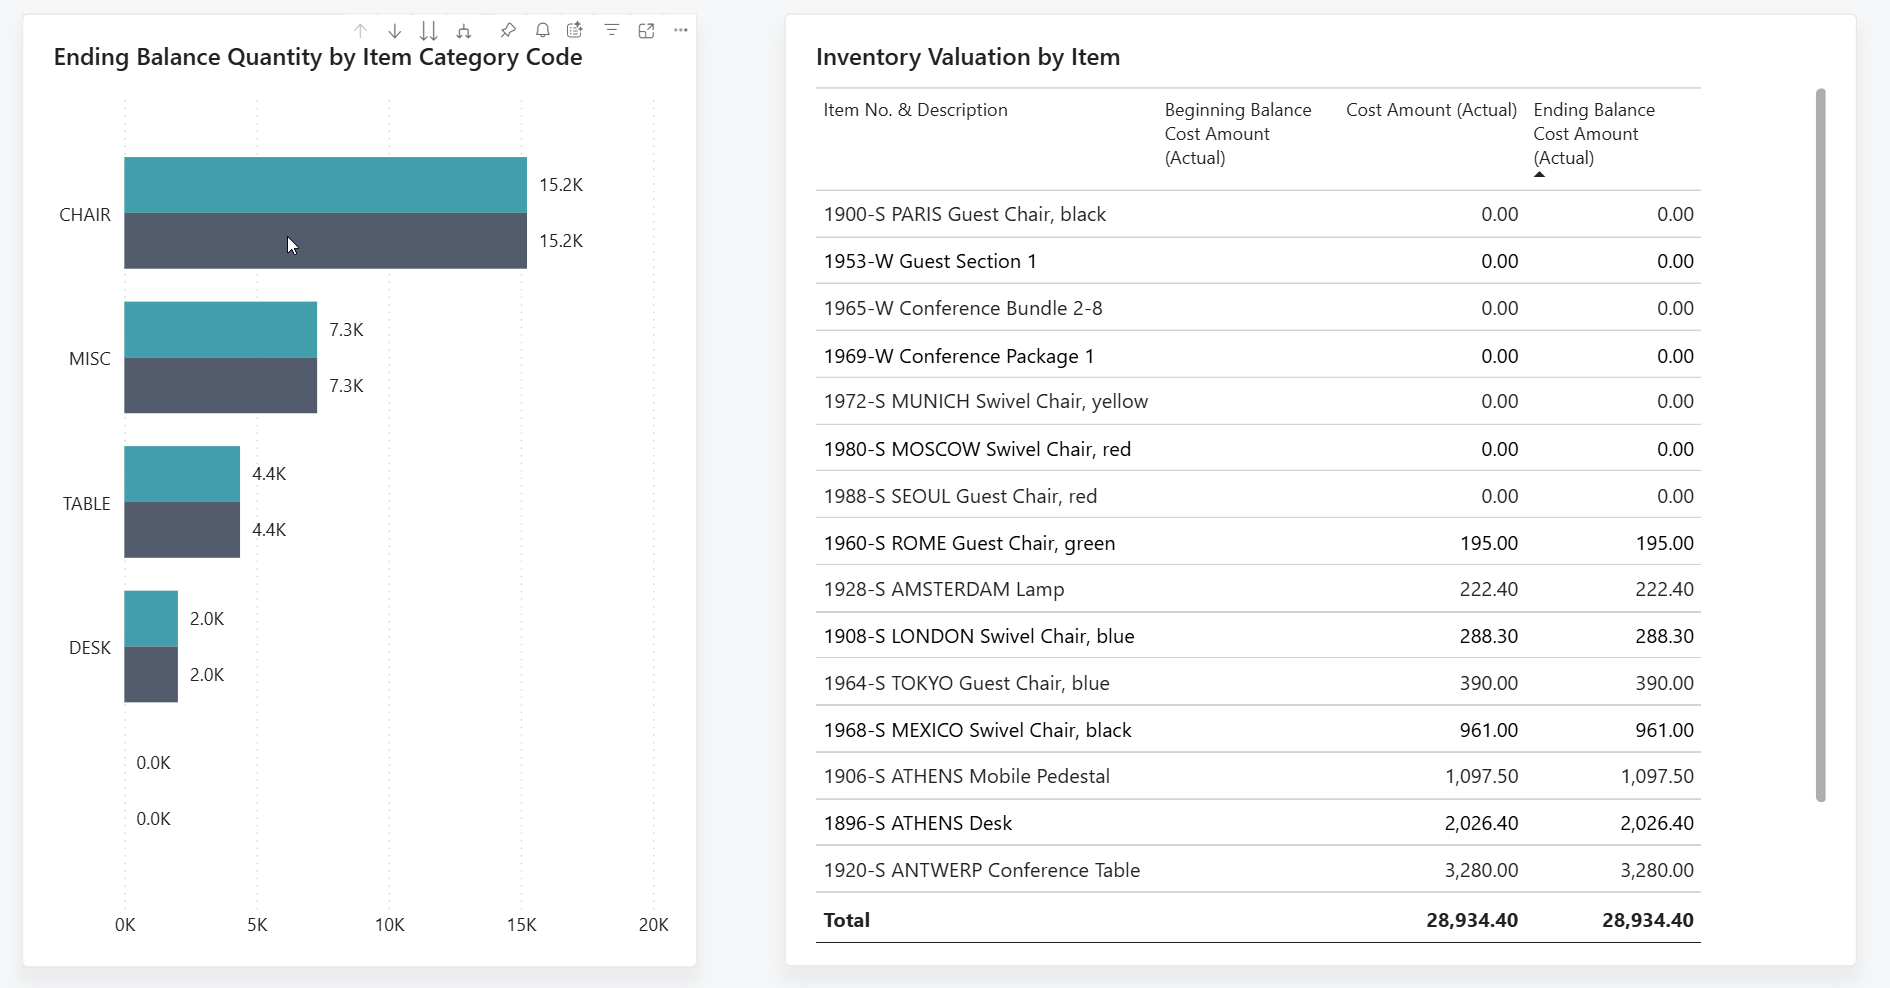
Inventory Reports
Inventory reporting ensures accurate stock valuation and efficient inventory management.
Key Insights:
- Stock valuation
- Inventory movement
- Available vs. projected inventory
The Inventory Valuation report plays a critical role in financial accuracy and operational planning.
Cues, Drilldown, and Insights
Beyond traditional reports, Business Central provides real-time visibility through cues, drilldowns, and insights.
Cues (KPI Tiles)
Cues are visual indicators displayed on the Role Center, providing instant access to key metrics.
Examples:
- Open sales orders
- Pending purchase orders
- Overdue invoices
These KPIs allow users to monitor business performance at a glance.
Drilldown Functionality
Drilldown enables users to explore detailed data behind summary figures.
Benefits:
- Quick access to transaction details
- Reduced dependency on reports
- Faster issue resolution
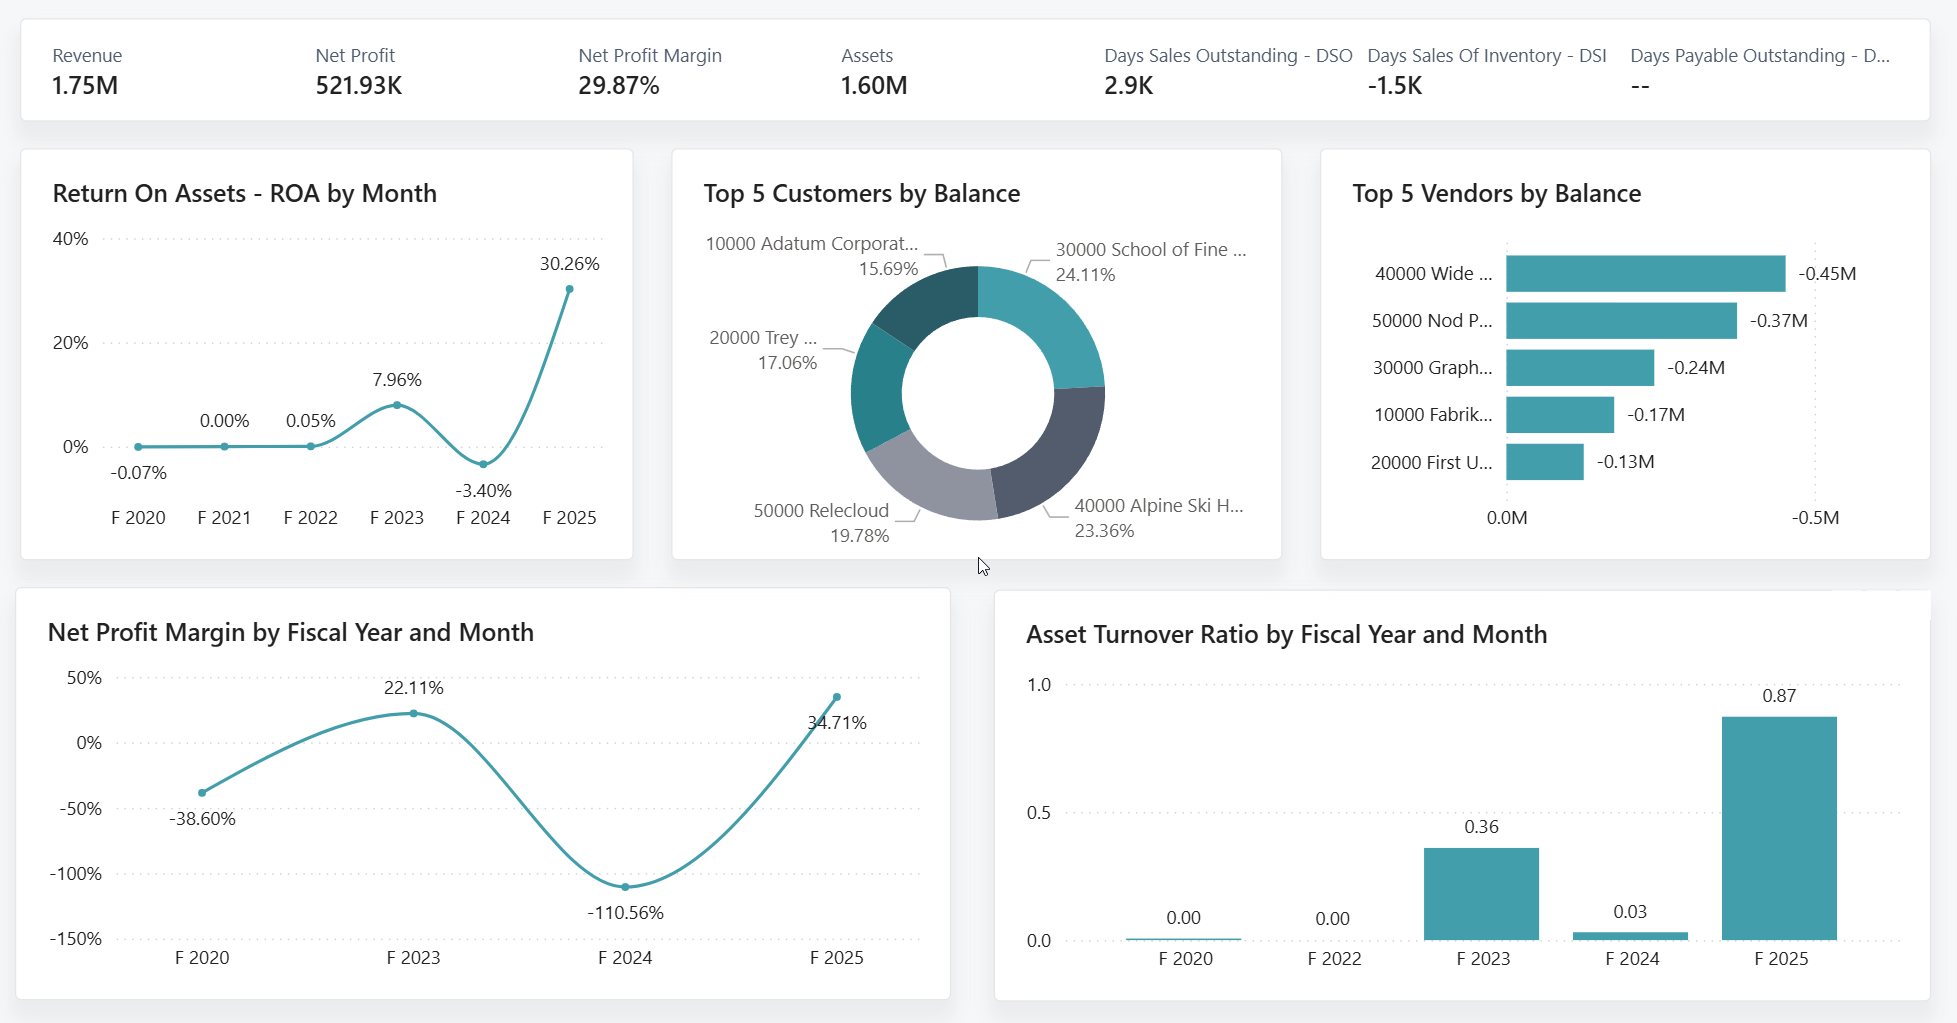
Insights and Dashboards
Business Central includes built-in dashboards such as Financial Overview, which provide visual insights into business performance.
Key Metrics Displayed:
- Revenue
- Net Profit
- Profit Margins
- Assets
These dashboards help users identify trends and patterns quickly.
Using List Pages for Quick Analysis
List pages in Business Central act as lightweight reporting tools, allowing users to filter, sort, and analyze data in real time.
Common Use Cases:
- Filtering customers with outstanding balances
- Sorting items by inventory levels
- Analyzing vendor transactions
This functionality enables quick decision-making without running formal reports.
Power BI for Advanced Analytics
While Business Central provides operational reporting, Power BI enhances analytics with advanced visualization and interactivity.
Executive Dashboards
Power BI dashboards present high-level KPIs in a visually appealing format.
Key Metrics:
- Total Assets
- Total Liabilities
- Total Revenue
- Net Income
Trend Analysis
Power BI enables businesses to track performance over time using interactive charts.
Capabilities:
- Monthly sales trends
- Year-over-year comparisons
- Performance tracking
Customer Insights
Understanding customer behavior is essential for growth.
Insights Provided:
- Top customers by revenue
- Sales distribution by category
- Customer segmentation
Vendor and Purchase Analysis
Power BI provides deeper visibility into procurement activities.
Insights Provided:
- Vendor contribution
- Purchase distribution
- Cost optimization opportunities
Combining Business Central and Power BI
When combined, Business Central and Power BI provide a comprehensive reporting and analytics solution.
- Business Central handles operational reporting
- Power BI delivers advanced analytics
- Together, they enable better decision-making
How This Supports Better Decision-Making
Organizations that leverage both platforms benefit from:
- Improved data visibility
- Faster reporting cycles
- Better financial planning
- Enhanced operational efficiency
Conclusion
Reporting and analytics are critical components of modern business management. Microsoft Dynamics 365 Business Central provides a strong foundation for operational reporting, while Power BI enhances those capabilities with advanced analytics and visualization.
By combining these tools, businesses can move beyond static reports and unlock real-time insights that drive growth and efficiency.
Microsoft Reference Links